Balance of payments : Surplus and Deficit

- Current account
- Visible trade
- Invisible trade
- Official financing and currency flow
- Trends in the UK balance of payments
Avail Your Discount Now
Discover an amazing deal at www.economicshomeworkhelper.com! Enjoy a generous 10% discount on all economics homework, providing top-quality assistance at an unbeatable price. Our team of experts is here to support you, making your academic journey more manageable and cost-effective. Don't miss this chance to improve your skills while saving money on your studies. Grab this opportunity now and secure exceptional help for your economics homework.
We Accept


The balance of payments is a comparison of a country's total expenditure abroad with its total income from other countries. If the UK's income from abroad is greater than its total expenditure abroad, then we have a surplus on our balance of payments. If expenditure abroad exceeds income, then there is a balance of payments deficit.
Table 9.1 gives a breakdown of the UK's balance of payments from 1976 to 1980. The most important balance is the current account balance.
Table 9.1 UK Balance of payments 1976 to 1980
| 1976(£m) | 1977(£m) | 1978(£m) | 1979(£m) | 1980(£m) | |
| Seasonally adjusted | |||||
| Trade in oil | -3947 | -2771 | -1999 | -774 | +273 |
| Non-oil visible trade | +20 | +492 | +453 | -2723 | +904 |
| Total visible trade | -3927 | -2279 | -1546 | -3496 | +1177 |
| Invisible trade | +2811 | +1995 | +2166 | +1867 | +1560 |
| Current account balance | -1116 | -284 | +620 | -1630 | +2737 |
| Not seasonally adjusted | |||||
| Current account balance | -1116 | -284 | +707 | -1630 | +2737 |
| Long-term capital | -119 | +2829 | -2209 | -3226 | -3949 |
| Basic balance | -1235 | +2545 | -1508 | -4856 | -1212 |
| Short-term capital and Misc | -2393 | +4817 | +376 | +6566 | +2404 |
| Overall balance | -3628 | +7362 | -1126 | +1710 | +1192 |
| Allocation of SDRs | __ | __ | __ | +195 | +180 |
| Reserves | +853 | -9588 | +2329 | -1059 | -291 |
| Borrowing | +2775 | +2226 | -1203 | -846 | -1081 |
Current account
The current account is the best indicator of the UK's ability to pay her way in the world (see Fig. 9.1). The balance of payments on the current account records the value of UK transactions with other countries carried out within a single year. This balance may be compiled for a calendar year or a financial year. The term 'balance' is somewhat of a misnomer because the result of foreign trade transactions can never be expected to balance exactly; in a given year, there will either be a favourable or an unfavourable 'balance'. The current account figures are the most commonly accepted measure of the balance of payments performance for any given year. The current account can itself be subdivided into:
- Visible trade The value of imports and exports of tangible, physical goods; this is termed the balance of trade and is usually adverse for the UK (see Fig. 9.2).
- Invisible transactions Profits, interest, dividends, insurance, banking, tourism, services of civil aviation, shipping, etc.
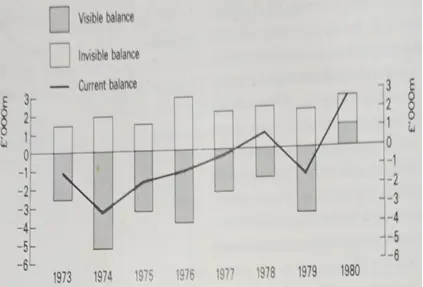
Figure 9.1 Balance of payments current account (seasonally adjusted) 1973 to 1980. (Source: 'Economic Trends, August 1981.)
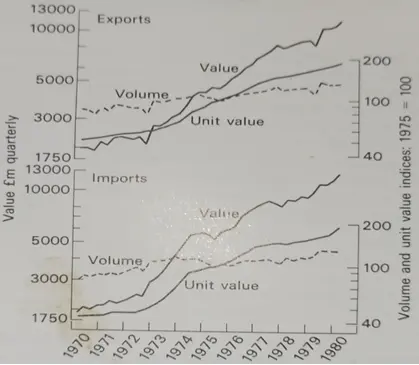
Figure 9.2 Visible trade 1970 to 1980. (Source: 'Monthly Review of External Trade Statistics', April 1980.)
Visible trade
- Exports In simple terms, the UK's factories pay for much of our food. The UK's exports consist mainly of manufactured goods (such as vehicles, machinery, radio, TV and electrical equipment). Table 9.2 divides our exports into four simple groups, although the two main manufacturing groups make up 87 per cent of the total. By far the most important group of exports com prises machinery and transport equipment. The share of chemicals has grown steadily to reach 11 per cent, but textile exports have declined from 18 per cent in 1948 to 3 per cent in 1980. Re-exports are goods that are exported either in the condition in which they are imported or after having undergone minor operations, such as blending or repacking. Traditionally, the greater part of the UK's re-export trade is in raw materials and foodstuffs (e.g., wool, rubber, tea, non-ferrous metals, and fur skins). In recent years, a considerable re-export trade has developed in manufactured goods, part of which is accounted for by machinery (e.g.. aircraft and aero-engines that have been repaired or overhauled in the UK). In the past, the UK was the 'workshop of the world, supplying, to a great extent, primary producing countries with manufactured goods in exchange for their food and raw materials. The UK is now becoming increasingly a 'workshop for other workshops, which have the strongest demand both for our machinery and our consumer goods. There are also continual changes taking place in the pattern of the UK's import and export distribution. Trade with Europe has increased, while trade with the Commonwealth has decreased, as a percentage of total values. Commonwealth countries such as Canada, Australia, New Zealand, and India remain among our most important trading partners, but the USA is now the UK's largest single source of supply (and incidentally our largest market).
- Less than 20 per cent of our exports now go to the traditional sterling area, whereas in 1960 this area absorbed nearly half of all British exports.
- Over 50 per cent of our exports go to Western Europe, compared with about 10 per cent in 1960.
- Imports For the people of the UK, life would be very bleak without imports, especially as about half our foodstuffs come from overseas (see Fig. 9.3). Without imports we should not be able to support anywhere near such a large population. We are dependent on other countries for most of our raw materials too, except for coal. These raw materials (such as chemicals, textiles, leather, paper, metals, mineral fuels, and lubricants) serve as the basis for most of our manufacturing industries.
There have been two main changes in the distribution of UK exports, in the last two decades:
Although the UK is still one of the largest importers of food in the world, the value of its imported foodstuffs has been growing less rapidly than the value of total imports. The ratio of imported food supplies to total imports fell from 39 per cent in 1955 to 15 per cent in 1980. There has been a similar downward trend in the import of basic materials from 30 per cent in 1955 to 8 per cent in 1980.
In recent years, there has been a significant rise in the proportion of imports of manufactured goods (now about 35 per cent in value terms) and semi-manufactured goods (28 per cent of total imports). Imports of petroleum and petroleum products are likely to fall in both value and volume, reflecting the increasing production of North Sea oil. In 1980, they amounted to about 10 per cent of UK imports. The UK's imports may be divided conveniently into five sections:
- Basic raw materials.
- Finished manufactured goods.
- Semi-manufactured goods.
- Food, beverages, and tobacco.
- Petroleum and petroleum products.
You may come across the initials 'f.o.b.' and 'c.i.f." when studying international trade imports and exports. 'Fob' means free on board (i.e., the value of the goods when they are shipped) while 'cif' means that the price includes cost, insurance, and freight.
Table 9.2 UK's main exports 1980
| % | |
| Engineering products (machinery, vehicles, etc.) | 37 |
| Other manufacturers (metals, chemicals, textiles, etc.) | 44 |
| Food, drink, and tobacco | 8 |
| Miscellaneous exports | 11 |
| Total | 100 |
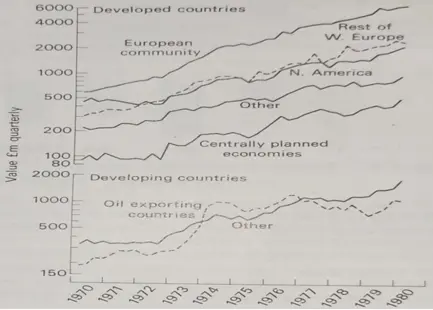
Figure 9.3 Imports by major areas 1970 to 1980. (Source: 'Monthly Review of External Trade Statistics", April 1980.)
Invisible trade
Fortunately, it is usual for the UK to have a surplus balance on invisible, and these earnings improve our current account situation. The UK, in contrast to many of its major exporting competitors, has earned a persistent surplus on invisible transactions for at least 200 years. Only the USA earns more gross income from invisible than the UK, and these two countries dominate the field of invisible exports. The main invisible items are given below.
- Interest, profits, and dividendsThese comprise the largest net overseas earnings of the UK and arise in various ways:
- Investment by British companies in their overseas affiliates, e.g., British oil companies with international connections.
- Investment by UK citizens in companies abroad.
- Loans by the UK Government to foreign governments.
- Loans raised by foreign governments from British financial institutions.
- Shipping and civil aviation In this context, we are referring to freight and passengers carried by British shipping and aircraft and not to the sale of ships or aircraft.
- Banking and other financial services provide important credit items for the UK. British clearing banks have offices and businesses overseas and, in addition, supply a continuous flow of invaluable information about economic opportunities abroad. There are also British overseas banks with branches outside the UK, but with head offices in London. These banks attract earnings by increasingly diversified activities, basically from finance for external trade and providing domestic banking service in foreign countries. The discount houses in the city of London are not large earners of foreign currency, but they facilitate the flow of trade between the UK and other countries. A British exporter of machine tools to Africa goes to a merchant bank or discount house. The discount house provides him with ready money in return for a bill of exchange under which the African customer agrees to pay the holder of the bill the amount owing after a certain period (usually three months).
- The British insurance industry This has always been a large earner of overseas currency. The figure is higher if Lloyds, brokerage, and other ancillary insurance services are included. The USA, the Commonwealth, and South Africa form the main traditional markets for British insurance.
- Tourism The tourists who spend most in this country come from the USA and Europe and usually provide a slightly favourable balance (see Fig. 9.4).
- Commodity markets Situated mainly in London, their invisible earnings are difficult to calculate, but apart from profits and commission, there is an advantageous 'spin-off for insurance, banking, and transport services.
- British export houses They are peculiarly British institutions offering unrivalled knowledge of world commerce based upon the UK's enormous trading activities over a long period.
- British consulting firms These firms receive large fees and cover a wide spectrum of activities including architecture, engineering, and management. planning, and surveying. The British Consultants Bureau promotes the overseas work of British consulting firms by such methods as sending fact-finding missions, collecting project information, and cooperating with international agencies.
- Other professional services These are services rendered to foreigners by lawyers, accountants, and others. The Report of the Committee on Invisible Exports stated that the overseas earnings by the professions were significant to the total earnings from invisible exports.
- Advertising agencies Second only to those in the USA in the extent of overseas activities, there are over 250 such agencies in the UK.
- Entertainment This covers a wide field of overseas trade including records and music publishing, rental of films and TV programmes, theatrical companies and royalties, copyright, and agency fees.
- Miscellaneous Such invisible exports include:
- Overseas construction work.
- Spending in the UK by foreign students.
- Spending by overseas government embassies, consulates, diplomats, military forces, and ancillary staff, based in the UK.
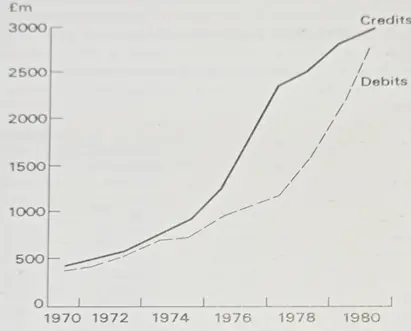
Figure 9.4 Invisible trade in travel from 1970 to 1980. (Source: UK Balance of Payments 1981. Economic Progress Report, November 1981)
Official financing and currency flow
For many years there was increasing dissatisfaction with the traditional form of the balance of payments format. The principal objection to the conventional method was that the balance of payments 'pseudo problem', to use the term adopted by Samuel Brittan in The Price of Economic Freedom (Macmillan), dominated political and economic arguments to an unwarranted extent. Assertions that Britain was near bankruptcy were not made in the nineteenth century because at that time no serious attempts were made to compile balance of payments statistics. The so-called capital account can only be a yardstick over a long period. The famous or infamous 1964 deficit of over £700 million was a short-term problem and much of the deficit was brought about by capital outputs that later brought a return in capital inputs.
In recent years, the current account has been given more emphasis and capital movements have been shown separately (see Table 9.1).
Currency flow represents the inflow of foreign funds into the UK and the outflow of currency from this country to overseas countries. To have a complete picture of the balance of payments we must examine official financing (see Table 9.3). Official financing shows how currency flow is financed. In Table 9.3, certain amounts are marked with a plus sign: this means that money is coming into the country and the plus sign indicates an addition to our supply of foreign currency reserves, capital, money for investment, gold, or special drawing rights (SDRs are a type of paper gold introduced because of the shortage of world liquidity, i.e., money to finance world trade). Other amounts are marked with a minus sign to show that currency is flowing out of the country.
A plus or a minus sign may be a good or bad thing for the country. A plus sign may mean that currency is flowing into the country in the form of overseas investment, and that American firms such as Chryslers, Fords, or General Motors have taken over a large share of our motor industry, once owned by British firms. A minus sign may mean the UK has fulfilled her obligations to the IMF by paying her subscriptions in gold. So it would not be correct to treat a plus sign as necessarily favourable to the UK. It is sufficient to realize that in the short run the current account need not show an annual favourable balance, but in the long run, we must attempt to make it balance. This we try to do by taking measures to correct our balance of payments, so that our currency flows out in a useful way, e.g., to pay old debts or to be invested for productive purposes to earn foreign currency.
Table 9.3 Britain's balance of payments including official financing from 1970 to 1980
| Current balance (£m) | Balance for official financing (£m) | SDR allocation, gold subscriptionto IMF(£m) | Official financing (£m) | |
| 1970 | +776 | +1287 | +133 | -1420 |
| 1971 | +1150 | +3146 | +125 | -3271 |
| 1972 | +208 | -1265 | +124 | +1141 |
| 1973 | -875 | -771 | __ | +771 |
| 1974 | -3307 | -1646 | __ | +1646 |
| 1975 | -1621 | -1465 | __ | + 1465 |
| 1976 | -842 | -3629 | __ | +3629 |
| 1977 | +293 | +7361 | __ | -7361 |
| 1978 | +1032 | -1126 | __ | +1126 |
Source: UK Balance of Payments, 1979.
Trends in the UK balance of payments
A detailed examination of the current account section of the UK balance of payments (see Table 9.1) reveals that:
- oil trade moved from an approximate £4000 million deficit in 1976 to a credit position by 1980.
- Non-oil visible trade usually shows a favourable balance, apart from during the deep recession of 1979.
- Visible trade as a whole (i.e., oil and non-oil) is normally in the red, apart from the unusual credit balance of 1980-81.
- Invisible trade continues to show a favourable balance.
- The current account balance was in a healthy position in the early eighties.
There are underlying factors that ought to be considered in detail because they reveal trends likely to affect the UK balance of payments in future years. Although no trade figures appeared for six months up to September 1981 (owing to a Civil Service dispute), the favourable trend has continued. The surplus on visible trade alone reached a remarkable surplus of over £1000 million for January and February 1981 (see Fig. 9.5), while the invisible surplus was £1300 million for the first quarter. The overall trend for the first quarter of 1981 was in the order of £3000 million.
The UK's favourable current balance in 1980 coincided with a trade balance of £700 million with the other countries of EEC. Oil was an important factor in the rise in the value of UK exports, but so was the performance of the British manufacturing industry. UK's trade with the rest of the EEC amounted to 43 per cent of its trade with the world as a whole; if the UK continued to have a surplus with the EEC then this would be an important and healthy reversal of previous trends (see Table 9.4).
Paradoxically, the UK balance of payments surplus in the eighties was in no small part due to the recession, which has meant that British companies have ordered fewer raw materials and other factor inputs from foreign countries. Hence there was an approximate 11 per cent fall in the volume of UK imports in 1980. There was a corresponding fall of about 2 per cent in our exports, but exports held up remarkably well considering the strength of the sterling. Export figures have been improved by oil exports, which moved into the black in 1980. In terms of the overall effect on the UK balance of payments, the influence of UK oil wealth upon investment and other capital flow accounts is very significant. Several possible explanations have been suggested to account for the paradoxical strength of UK exports in 1980 in the face of the rising pound. These include:
- Manufacturers had a high level of stocks because of the low level of home demand and were thus able to fulfil export orders more speedily.
- The rising exchange rate persuaded potential customers to expedite decision-making and place more orders in the UK.
- Higher prices of UK exports tended to add prestige to products (see A status symbol society Topic 10.2).
- Foreigners who invested funds in sterling (possibly because of UK oil wealth) tended to favour products from the sterling area; there was increased confidence that the UK was now better placed to survive international crises and would therefore be able to fulfil contracts and meet deliveries.
- Exporters were forced to be more efficient to combat the high price of sterling and the competition of foreigners such as the Japanese.
- The markets in which the UK is strong, such as the OPEC countries, held up better than world trade as a whole. The UK was one of the few countries in the world that was actually in surplus with the Middle East in 1980.
By the end of 1982, for the first time since the end of the Second World War, the UK achieved a surplus with the rest of the world on trade in goods (ie., visible trade) for three consecutive years. This was mainly caused by our surplus on oil trade, which now adds to our traditional surplus on manufactured goods. Invisible trade in services continues to flourish and accounts for about a quarter of total UK exports. Our main problem is the continued increase in imports of manufactured goods.
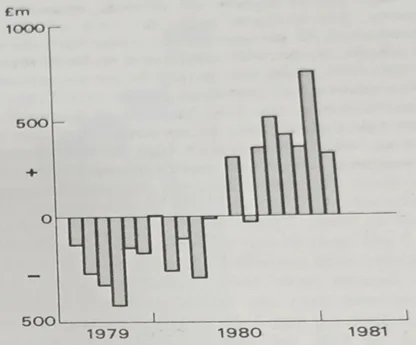
Figure 9.5 UK trade 1979 to February 1981 (seasonally adjusted). (Source: Financial Times, 19 October 1981.)
Table 9.4 Total trade with the EEC 1970-80 ( billion)
| Years | Exports | Imports | Total |
| 1970 | 2.4 | 2.3 | 4.7 |
| 1971 | 2.5 | 2.7 | 5.3 |
| 1972 | 2.8 | 3.4 | 6.3 |
| 1973 | 3.8 | 5.2 | 9.0 |
| 1974 | 5.5 | 7.7 | 13.2 |
| 1975 | 6.2 | 8.7 | 15.0 |
| 1976 | 8.9 | 11.2 | 20.1 |
| 1977 | 11.7 | 13.6 | 25.3 |
| 1978 | 13.4 | 15.9 | 29.2 |
| 1979 | 17.3 | 19.9 | 37.3 |
| 1980 | 20.4 | 19.7 | 40.1 |
You Might Also Like
Discover our International Economics homework blog, a treasure trove of expertise and insights. Dive into expert strategies, emerging global trends, and innovative approaches for a comprehensive understanding of vital concepts. Engage with our recent articles to gain fresh perspectives on essential international economic topics.