Measuring the Changes In The Value Of The Money

Avail Your Discount Now
Discover an amazing deal at www.economicshomeworkhelper.com! Enjoy a generous 10% discount on all economics homework, providing top-quality assistance at an unbeatable price. Our team of experts is here to support you, making your academic journey more manageable and cost-effective. Don't miss this chance to improve your skills while saving money on your studies. Grab this opportunity now and secure exceptional help for your economics homework.
We Accept


It is not possible to measure the value of money. because the value of money means very different things to different people. The value of our money depends upon the price of the things that we buy with it. If you could find two people who had the same income and spent their money in the same proportions on the wide variety of things offered for sale in the complex modern world, then you would have found two people to whom the value of money means the same thing; but this would be an almost impossible coincidence. We are only able to measure changes in the value of money in a very general way. Apart from the abnormal case of a miser, money has no value merely for its own sake. In Daniel Defoe's novel, Robinson Crusoe found no real value in the European and Brazilian coins that he discovered on the wrecked ship; the value of money is its power to command goods in exchange, and in Robinson Crusoe's case there were no goods on the island to purchase.
We cannot measure changes in the value of money with any exactitude. Economists and government statisticians attempt to measure changes in the value of money applicable to an average family by the Index of Retail Prices. However, this Index only gives a very generalized picture, although it has great value to many classes of people.
As it is difficult to measure changes in the value of money for different people in the UK, it is even more difficult to make accurate comparisons between the purchasing power of money in different countries. The Chinaman may spend much of his money on rice and, therefore, any changes in the price of rice would be very important to him. The average level of prices of consumer goods and services in a country is called the cost of living. The standard of living refers to the amount and type of goods and services consumed. The people of the USA have the highest standard of living in the world if one considers the number of comforts possessed by the average American, i.e., the number of motorcars, TV sets, washing machines, dishwashers, and refrigerators per head of the population. The cost of living depends on the prices of the things a family buys, but what people buy depends on the family income. An attempt can be made to measure changes in the standard of living by comparing wage increases with price increases and calculating changes in spending power.
A study of prices forms the main subject matter of economics; prices and the value of money are closely related because, if prices rise, then the value of money will fall and vice versa. The many groups who are vitally concerned about changes in the value, of money include:
- Workers who want increased wages because of an apparent rise in the cost of living.
- Employers who wish to resist wage claims and who will need to be conversant with other indices, such as :
- The Index of Wholesale Prices.
- The Index of Earnings.
- The Index of Wage Drift.
- The Index of Stock Market Prices.
- Employees whose wages are based on movements in the Cost of Living Index; their employers who agreed to the 'sliding scale' contract will need to be aware of any extra financial commitments that arise through increases in the wage bill.
- The husband who wishes to contest his wife's claim for a 10 per cent increase in housekeeping will wish to know whether prices, in general, have increased by 10 per cent since her last increase. If he is both fair and shrewd, he may examine the subsections of the Index to ascertain whether the things that his wife buys have increased most, e.g., have recent inflationary trends been caused by rises in the cost of electricity, gas, mortgage repayments, petrol, rates, etc., or by increases in the cost of food and clothing?
- Entrepreneurs wish to judge their profit potential and plan future production in light of recent price increases and trends.
- The Government will wish to know how well its policies are succeeding or how much else needs to be done to fulfil election promises. The Government is also vitally concerned with the movements of the various indices because a government must have overall surveillance of the entire economic system. Price indices are compiled by the Employment Gazette, The Economist, and other economics publications.
- A base year, or starting point, has to be chosen. The average level of prices at the base year is represented by 100. Other years are compared with the base year in the same way as geographers compare heights and depths above or below sea level. The current Department of Employment Index is based on prices charged in January 1974. Previous base years selected have included 1962, 1956, and 1947.
- A list is drawn up of 350 commodities and services likely to be purchased by an average family. Some goods are relatively more important than others, so a system of weighting is used. For this purpose, goods and services are divided into 11 classes (see Table 17.1). An appropriate weighting is given to each class. The food section is based on the average expenditure on the food of households (excluding those of pensioners and those where the head of the household earns £185 a week or more) over the past three years and repriced at January 1974 prices.
- Prices prevailing on a Tuesday near the middle of the month are compared with the average level of prices on 16 January 1974. About 150,000 quotations are taken each month from shops throughout the UK. The prices are those that are charged for economic goods and services.
- The average percentage change in price, since the base date, is then worked out for each separate commodity and service. The procedure for arriving at this average percentage change is a complicated business and is not the same for every type of commodity or service included in the Index. We are only concerned with the average percentage change expressed on a points system.
- Innovations ensure that new goods continually appear on the market. The pattern of people's spending is continually altering but changes in the goods and services (chosen as representative for purposes of the Index) will of necessity be tardy.
- Apart from new goods that would not have been bought some years ago, as income increases, people will tend to substitute 'superior' goods for 'inferior' goods. Here again, the Index may lag what is happening in the market.
- The first two difficulties necessitate occasional changes in the base year. However, as soon as the base year is changed, all comparisons with indices made before the base year become less valid. It is not possible to compare accurately the cost of living in 1914 with the cost of living in 1980, because people just do not buy the same things.
- Some goods purchased are more important than others; the price of butter is more important than the price of nails. This snag is mitigated by 'weighting'. One ought not to be confused here with so-called 'necessities' and 'luxuries'. If the average family spends more on tobacco, alcoholic drinks and restaurant meals than on the provision of housing, then changes in the prices of cigarettes, drinks and 'meals out' will have more effect on the cost of living than changes in rents and mortgage repayments. It may be your opinion that it is an indictment of the average British family that this state of affairs has existed for many years, but we have learnt that subjective opinions are of no economic significance.
- Although the Index allows a comparison to be made between average price levels, average prices may be less significant than particular prices. Average prices may rise while prices of goods of particular significance to a certain individual may fall. There is not one value of money, but millions of monetary values according to the number of people who are spending (see Fig. 17.1).
- The choice of goods to be used as yardsticks is rather an arbitrary matter. If only a very few goods are considered, then a false impression of general price movements might be given. It would be ridiculous to base an Index on two or three goods, and yet if a very large number of goods is included it is more likely that some of them will not have found popular favour. For example, does the average family eat asparagus or artichokes, black puddings, or spinach?
- It is very difficult to obtain accurate figures; the price of fresh vegetables may vary in different districts, and even in shops in the same town. However, the statisticians of the Department of Employment take elaborate precautions to ensure that they secure the most accurate figures possible, and the extended use of branded goods has made it easier to collate accurate prices, especially where uniform prices are maintained or if resale price maintenance still exists, e.g., for books, maps, and pharmaceutical goods. However, price slashing by hypermarkets, superstores, and supermarkets has increased the complications.
- The goods and services which are being compared are often not identical. Professor Robertson, in Money (Nisbet), reminds us that a bus ride sitting down is not the same as one where one has to stand. It is difficult to take into account differing qualities of goods in compiling the Index.
There are four main stages in the compilation of the Index of Retail Prices or the Cost of Living Index as it is sometimes called:
Although the Index is very important as an instrument for measuring changes in the value of money, there are imperfections in its compilation, although these should not tempt the student to dismiss it as completely false or valueless. The main snags of the Index are:
Table 17.1 Weightings of Retail Price Indices
| Group | 1956 (%) | 1962 (%) | 1974 (%) | 1980 (%) |
| Food | 35.0 | 31.9 | 25.3 | 21.4 |
| Alcoholic drink | 7.1 | 6.4 | 7.0 | 8.2 |
| Tobacco | 8.0 | 7.9 | 4.3 | 4.0 |
| Housing | 8.7 | 10.2 | 12.4 | 12.4 |
| Fuel and light | 5.5 | 6.2 | 5.2 | 5.9 |
| Durable household goods | 6.6 | 6.4 | 6.4 | 6.9 |
| Clothing and footwear | 10.6 | 9.8 | 9.1 | 8.4 |
| Transport and vehicles | 6.8 | 9.2 | 13.5 | 15.1 |
| Miscellaneous | 5.9 | 6.4 | 6.3 | 7.4 |
| Services | 5.8 | 5.6 | 5.4 | 6.2 |
| Meals out | __ | __ | 5.1 | 4.1 |
| 100.0 | 100.0 | 100.0 | 100.0 |
Note: After 1968, meals bought and consumed outside the home have been included as a separate category.
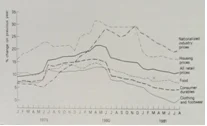
Figure 17.1 Rates of inflation in retail prices by categories from 1979 to 1981.
(Source: Economic Progress Report, October 1981.)